Data Exportation
How to Export
There are two buttons that can bring you to your results after a segmentation has been processed. The basic choice is to use the Data Export button on the left toolbar. This opens a popup where Trials and Missions can be selected. Bulk Exports are also possible from this popup, and downloading from multiple missions at once is usually quicker from here.
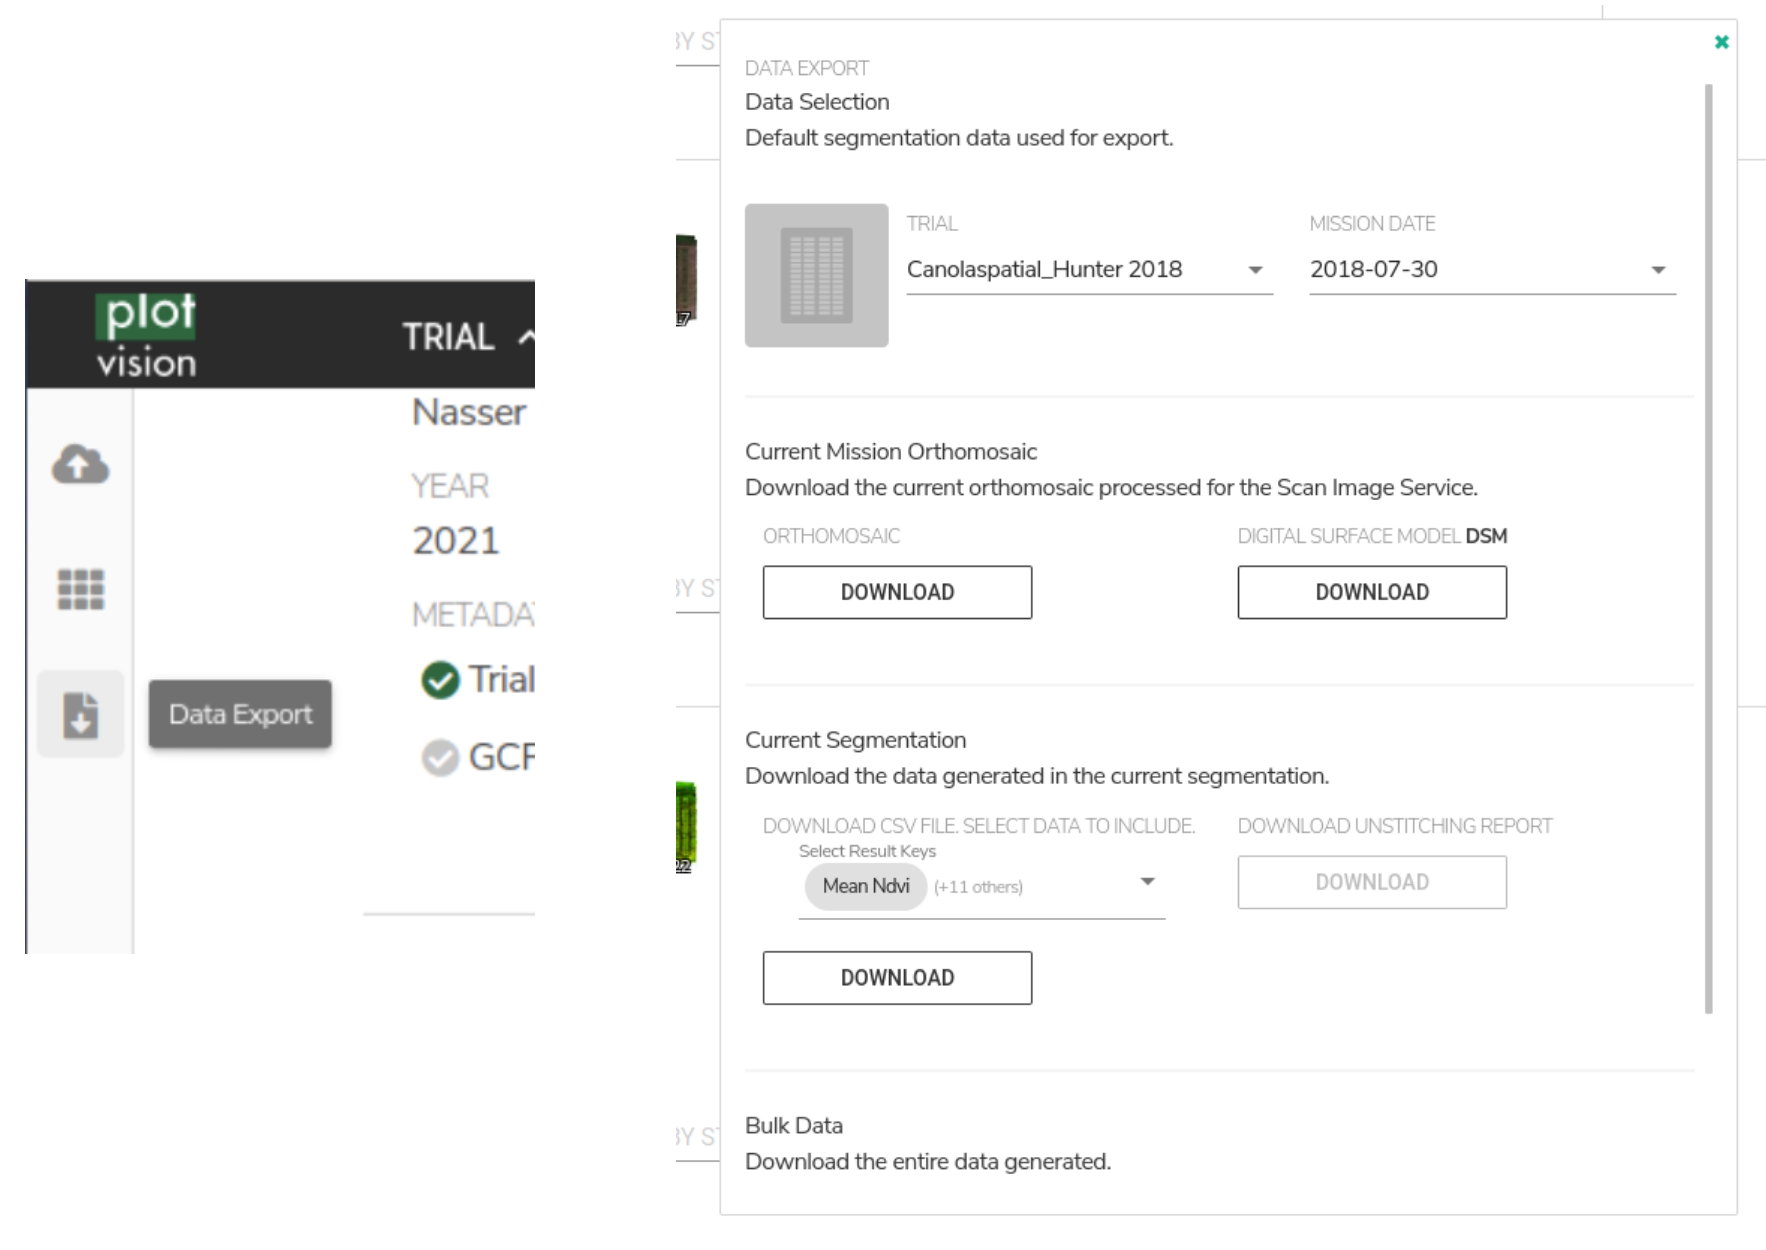
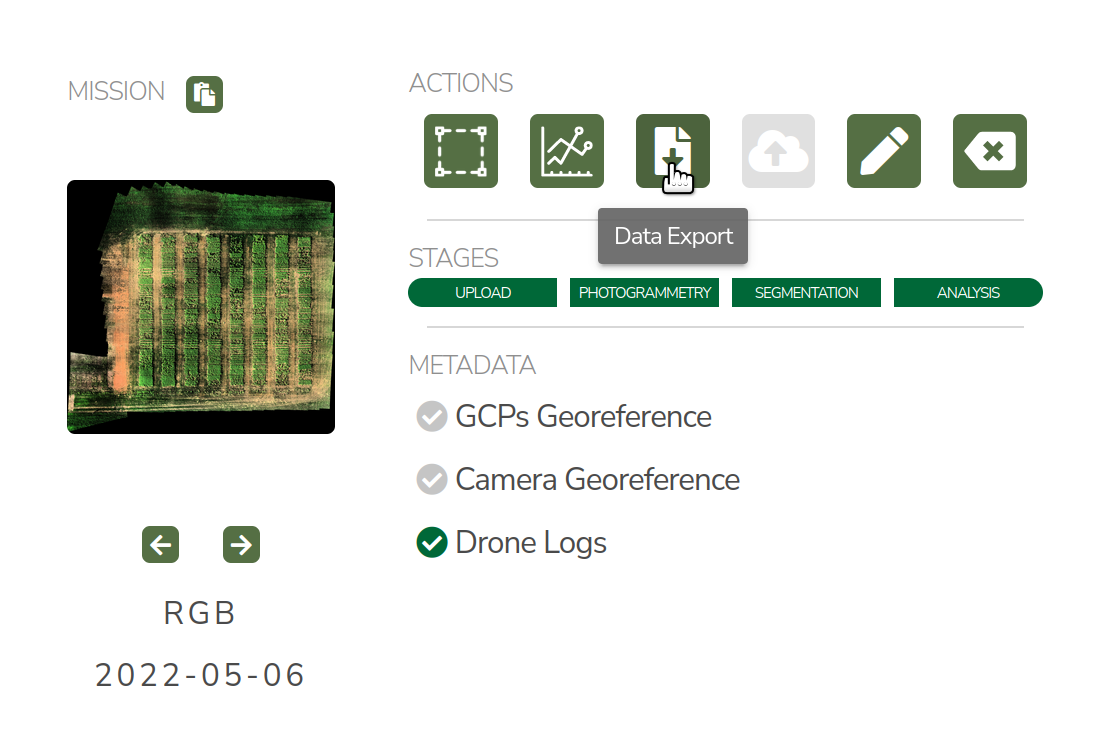
If data is only needed from a specific mission that you’ve already found in the dashboard, the export buttons from the mission panel are also an option. From here the same panel where you can export the orthomosaic, DSM, and CSV file will open.
CSV File Metrics
This is the information for all current PlotVision computed per-plot metrics, as exported in the results CSV. All CSV file metrics require Plot Extraction to generate. For each metric, the associated column names in the results CSV are detailed. See also Bands Specification and List of Indices below. All metrics are based upon the individual plot image & plot Digital Surface Model (DSM) extracted from the trial orthomosaic image & DSM. Thus all metrics are calculated from the ortho-rectified overhead perspective, and should only be evaluated in that context. Unstitched raw images are not currently included in analysis.
Included metrics:
Spectral Indices
Vegetation-segmented Spectral Indices
Canopy Height
Canopy Area
Canopy Volume
Canola Flower Area
Spectral Indices
A variety of spectral indices are computed for every plot image, depending on the available image bands. First, a single-band plot index array is computed, with the same dimensions as the plot image, where each pixel is a computed index value. Next, the index values are aggregated into scalar summary values over the whole image. Currently, the mean and standard deviation of the plot index array are computed.
- CSV column names
- mean_{INDEX NAME}: The mean value of all pixels in the plot index array.std_{INDEX NAME}: The standard deviation of all pixels in the plot index array.
INDEX NAME is specified separately for each index (see List of indices).
Vegetation-Segmented Spectral Indices
These values are calculated in the same way as Spectral Indices, with one extra step. Prior to aggregating the index into summary values, a vegetation mask is computed and applied for the plot image, separating the image into vegetation and non-vegetation pixels. Then the summary values for the index are computed for the vegetation pixels only. To create the vegetation mask, automatic thresholding is applied to the first spectral index available from NDVI, Excess Green, or Blue NDVI.
- CSV column names
- mean_{INDEX NAME}_segmented: The mean value of all vegetation pixels in the plot index array. This is an image that has been masked so that only vegetation pixels are included in the mean calculation.std_{INDEX NAME}_segmented: The standard deviation of all vegetation pixels in the plot index array.
INDEX NAME is specified separately for each index (see List of indices).
Canopy Area
Only available for georeferenced missions, where the width and length in UTM coordinates of each pixel can be computed. Canopy area is calculated by first computing a vegetation segmentation for the plot image, separating the image into vegetation and non-vegetation pixels. Then vegetation area in square meters is derived from GPS information.
- Where:
- V is the number of vegetation pixels in the plot image.N is the number of pixels in the plot image.A is the area of the plot as calculated from UTM coordinates.
- CSV column names
crop_area_m2_{INDEX NAME FOR VEGETATION SEGMENTATION}-based: plot canopy area in square meters, computed from the ortho-rectified overhead perspective.
Canopy Height
Only available for georeferenced missions, where the width and length in UTM coordinates of each pixel can be computed. Canopy height is calculated by first computing a vegetation segmentation for the plot image, separating the image into vegetation and non-vegetation pixels. Then elevation values in meters for plant pixels are then compared against the computed ground elevation, and height values are calculated. An aggregate of these height values are exported.
- Where:
- f is the vegetation segmentation function.H is the elevations of each pixel in the plot.G is the elevations of the ground level in the plot.
- CSV column names
- mean_crop_height_m_{INDEX NAME FOR VEGETATION SEGMENTATION}-based: mean plot canopy height in meters.median_crop_height_m_{INDEX NAME FOR VEGETATION SEGMENTATION}-based: median plot canopy height in meters.max_crop_height_m_{INDEX NAME FOR VEGETATION SEGMENTATION}-based: max plot canopy height in meters.std_crop_height_m_{INDEX NAME FOR VEGETATION SEGMENTATION}-based: standard deviation of plot canopy height in meters.
Canopy Volume
Only available for georeferenced missions, where the width and length in UTM coordinates of each pixel can be computed. Canopy volume is calculated by first computing a vegetation segmentation for the plot image, separating the image into vegetation and non-vegetation pixels. Then vegetation volume in meters cubed is derived from GPS information.
- Where:
- H is the canopy height in mA is the canopy area in m:sup:`2`
- CSV column names
- crop_volume_m3_{INDEX NAME FOR VEGETATION SEGMENTATION}-based: plot canopy volume in meters cubed.ground_dilation_pix_{INDEX NAME FOR VEGETATION_SEGMENTATION}-based: value used for internal debugging. Can be ignored.
Canola Flower Area
The area in meters squared covered by flowering canola from the ortho-rectified overhead perspective. Only relevant or included in crop that have flowering processes designed (such as canola).
- CSV column names
- flower_area_m2: The area in meters squared covered by flowering canola from the ortho-rectified overhead perspective.flower_fraction_of_plot_area: the fraction of the total area of the plot (soil included) that is covered by flowers.
Bands Specification
Metrics are currently calculated according to named colour bands, not by exact wavelength values. So two different cameras can have a different wavelength for “Red”, and PlotVision will naively treat them the same for the purposes of index calculations. Thus the onus is on the user to account wavelength differences between sensors. Nevertheless, a specification of roughly expected wavelengths follows:
Abbr. |
Band |
Colour Spectrum Range |
|---|---|---|
B |
Blue |
443nm - 507nm |
G |
Green |
533nm - 587nm |
R |
Red |
654nm - 682nm |
RE |
RedEdge |
705nm -729nm |
NIR |
Near Infrared |
785nm - 899nm |
List of indices
All current Spectral Indices and Vegetation-Segmented Spectral Indices for PlotVision. See Bands Specification for definitions of colour bands within formulas. INDEX NAME defines the name used for the index in the results CSV. It is very easy to add to this list. See here for suggestions. If you want an index to be added, please contact anyone on the PlotVision team.
- Anthocyanin reflectance index (ARI) [1]
- Formula: \(\frac{1}{G} - \frac{1}{RE}\)INDEX NAME: ari
- custom chlorophyll index (non-standard)
- Formula: \(\frac{1}{RE} - \frac{1}{NIR}\)INDEX NAME: chl
- Excess Green (ExG) [2]
- Formula: \(2G - B - R\)INDEX NAME: excess_green
- Normalized Difference RedEdge Index (NDRE) [3]
- Formula: \(\frac{NIR - RE}{NIR + RE}\)INDEX NAME: ndre
- Normalized Difference Vegetation Index (NDVI) [4]
- Formula: \(\frac{NIR - R}{NIR + R}\)INDEX NAME: ndvi
- Normalized Difference Yellowness Index (NDYI) [5]
- Formula: \(\frac{G - B}{G + B}\)INDEX NAME: ndyi
- Sentera NDVI [6] [7]
- formula: Custom NDVI formula for Sentera sensorsINDEX NAME: sentera_ndvi
- Sentera NDRE [6] [7]
- formula: Custom NDRE formula for Sentera sensorsINDEX NAME: sentera_ndre
- Normalized Green Red Difference Index (NGRDI) [8]
- Formula: \(\frac{G - R}{G + R}\)INDEX NAME: ngrdi
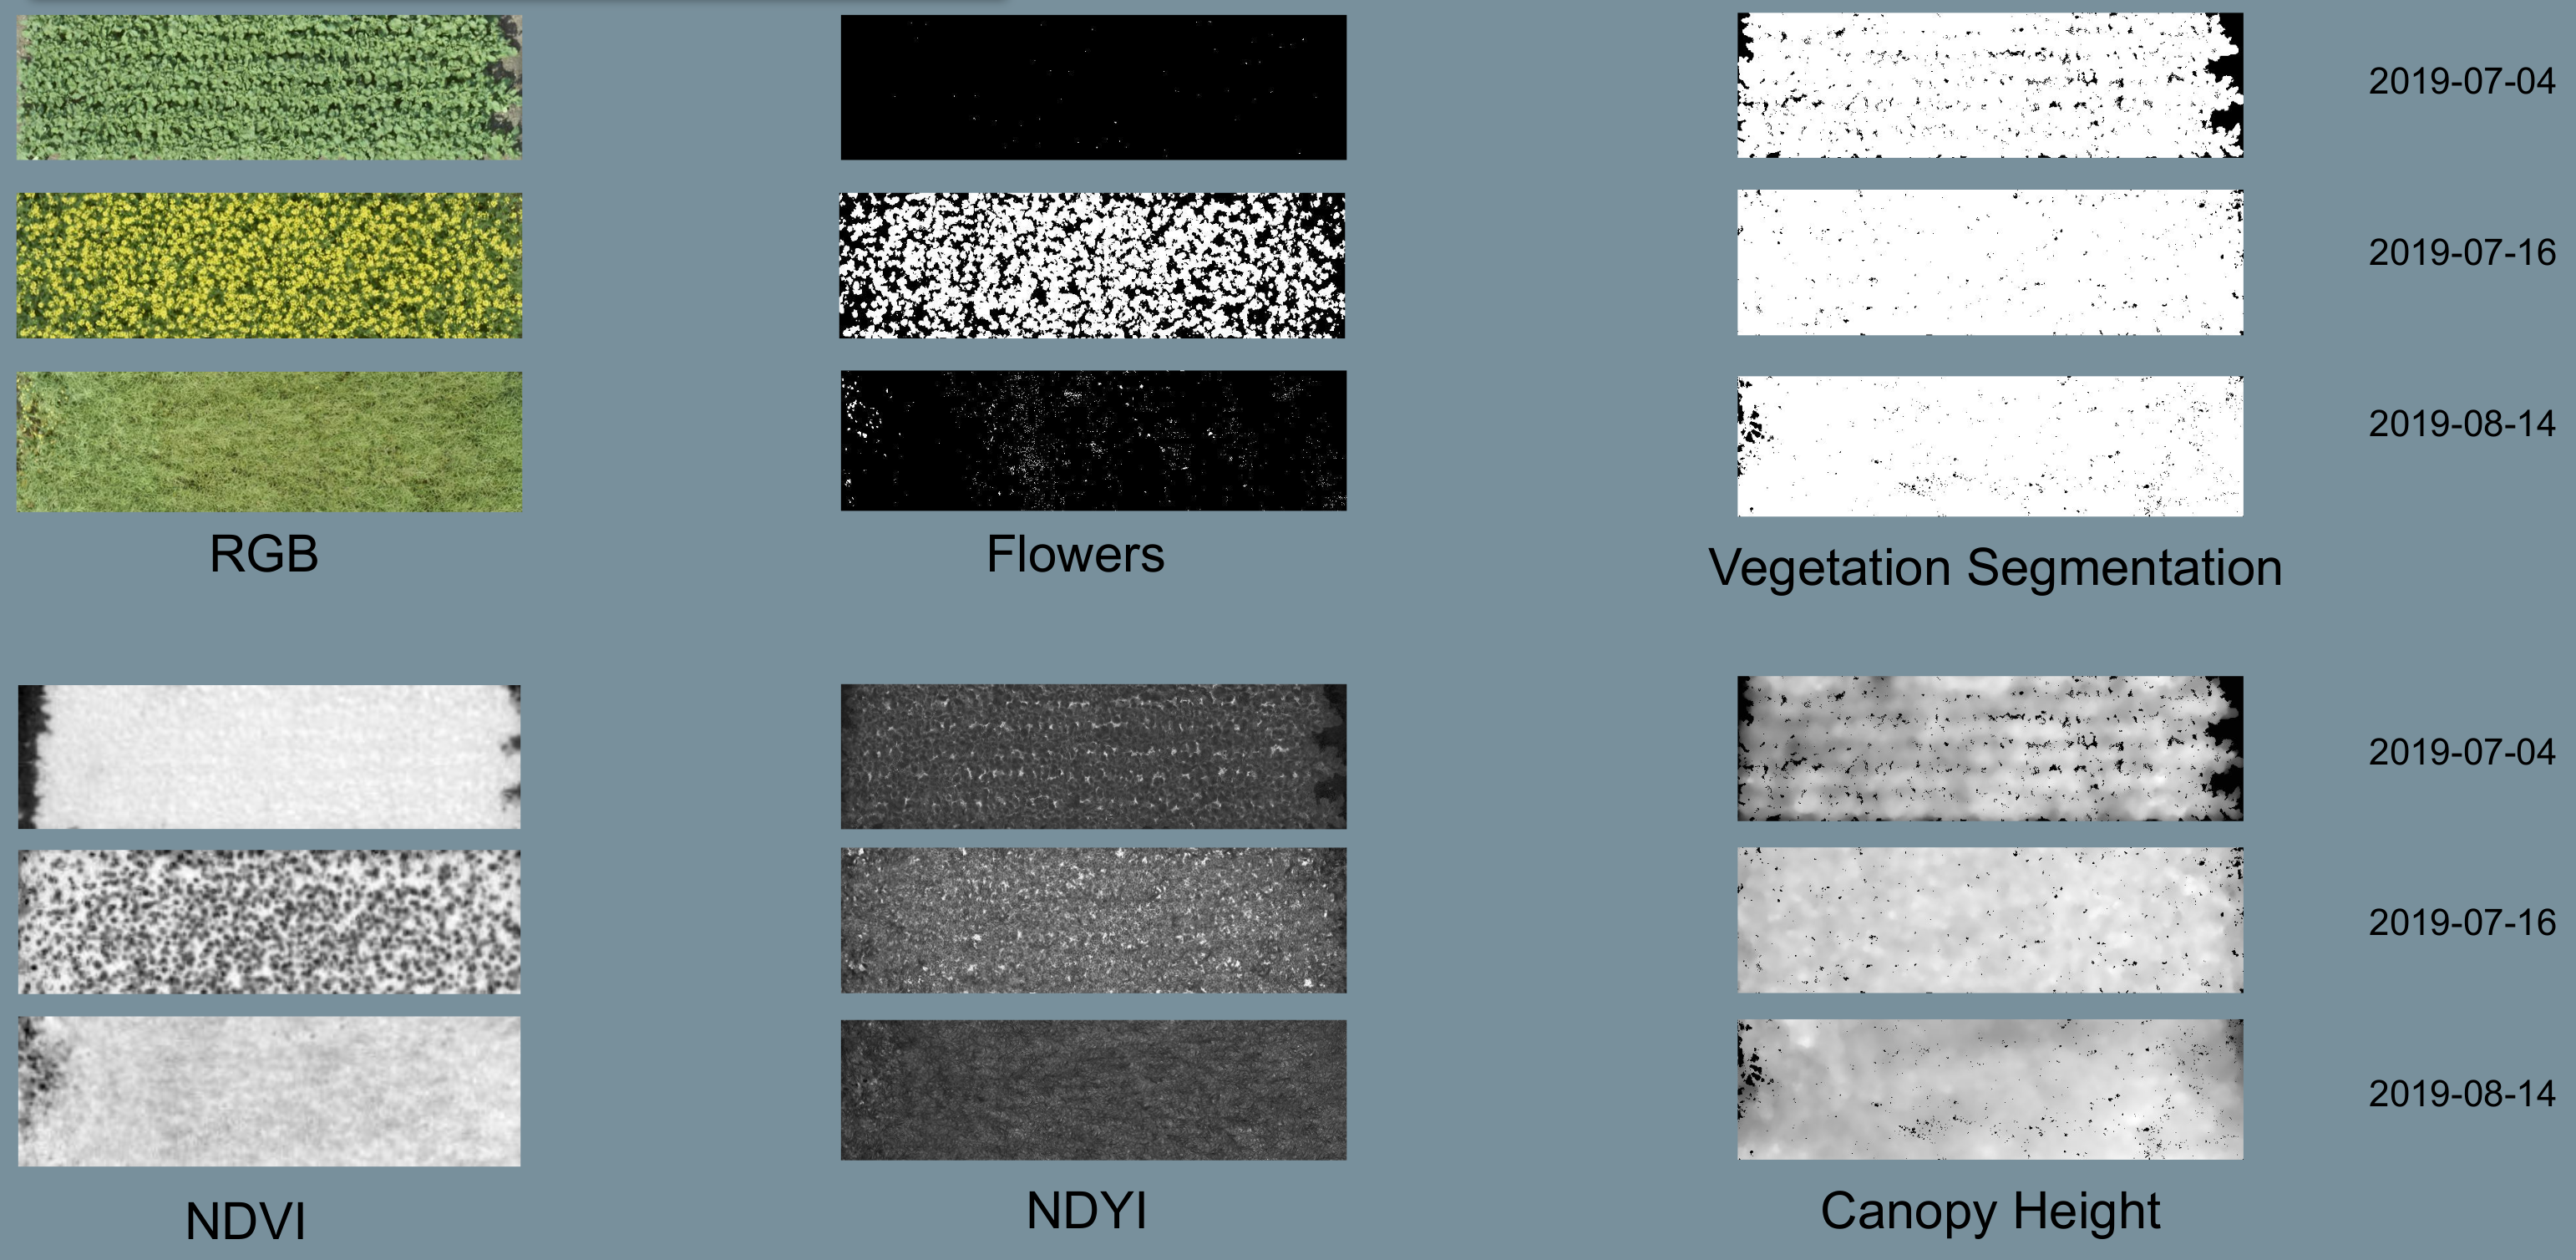
Image Exports
This section details all the various images available to export in PlotVision. The Orthomosaic and DSM exports are the most basic, and do not require Plot Extraction, but all other images do. Any image that requires plot extraction first should be found within a Bulk Export. Further, during plot extraction, the check box asking to generate the data should also have been checked.
Orthomosaic and DSM
The orthomosaic and DSM are the two most basic exports PlotVision provides. They require no extra input beyond the raw UAV images themselves (please look at Pre-Flight Information before imaging a research trial). Every mission will have the orthomosaic and DSM available for export from the dashboard as soon as stitching has completed.
The orthomosaic will be in .tif format, and have a number of channels equal to the input image. For example, for a RedEdge orthomosaic, the shape of the image will be (WIDTH, HEIGHT, 5), because a RedEdge camera captures 5 colour channels. RGB cameras cameras capture 3 channels. The DSM is a greyscale floating point image, where each pixel represents an altitude. The borders of both of these images will have a non-zero value to represent null, or a non-existent pixel value, usually set at the max possible value for the image type. If viewing these images in ArcGIS or QGIS, it is recommended to scale the image values to exclude the extremes of the border.
Cropped Orthomosaic Images
Cropped orthomosaic images are only available to export after a segmentation in which plot images were selected is finished processing. For each plot in the segmentation, the orthomosaic will be cropped to contain only that plot, named according to the plot name, and be saved in the same image format as the orthomosaic. These images are available for download in the Bulk Export section of the export popup, at the bottom. In the case of non-RGB orthomosaics, a “viewable_” version of the image should also be available. This would contain only the RGB channels of the image, and is designed only to be used by humans inspecting the data for accuracy.
Beyond this, the same orthomosaic with various spectral indices and metrics applied is also available for download. These images will usually be a greyscale version of the orthomosaic with the given metric applied. These images can be downloaded at the bottom of the export popup, under the options in a Bulk Export.
Cropped Index Images
Similar to the cropped orthomosaic images, these are only available after a successful segmentation in which plot images were chosen to be generated. These images will be in greyscale, and are simply the orthomosaic with the given spectral indices applied, then cropped to the plot.
Cropped _Segmented Index Images
The “_segmented” version are the same as cropped images, however they are masked such that only vegetation is included. Non-plant pixels have been blacked out using our proprietary vegetation segmentation algorithm, and plant pixels have remained untouched. This allows for computations that require only plant pixels. Similarly, these are the images used to generate the “_segmented” version of the CSV metrics.
To verify the accuracy of our vegetation segmentation algorithm, or for your own personal use, also provided in the export is the segmentation mask generated.
Other Non-Image Exports
There are a few other exports available in PlotVision that have not been covered so far. These are all available as options within the Bulk Export.
- Photogrammetry Report (PDF)
A PDF report on how the orthomosaic progressed. Details about georeferencing, camera tilt, and stitching parameters are included in here.
- Trial Metadata
Data uploaded by the user as information about the trial. This includes:
GCPs
Trial Map
Plots Info
- Plot Metadata (JSON)
A JSON format file of the plot segmentation.
“plots”: plot bounding boxes in the ortho
“trial corners”: corners selected by user when segmenting
“trial_corners_osvr”: trial corners again, but this time in the smaller, viewable, and rectified (oriented) orthomosaic.
- TFW Files
Georeferencing world files generated by the stitching program, or uploaded by the user in the case of a direct orthomosaic upload.
- UUID and GUID files
A few files in a bulk export could contain only the 16 digit IDs used internally. These are mainly for debugging purposes and can be ignored, unless asked for by Support.
- Shapefiles of plots
Currently not supported, but will be in a near future update. Please contact someone from the PlotVision team if you are looking to export your plots as Shapefiles. They will have similar specification as the required input for Shapefiles.
Correlations
Creating correlations and heatmaps is currently a work in progress for PlotVision development. It is not automatically included in any export. However, you can contact anyone on the PlotVision team and we’ll see what we can do for you.
Footnotes